
0. What is this post about?
The Indian government, via its annual budget, provides incentives to certain industry sectors. With the government’s support, these industry sectors are able to increase their revenue in the coming years. Typically, the government provides multi-year financial support spanning 5 years or more. This allows companies to plan for long term capital expenditure, and reap benefits from government schemes. Studying and understanding these government schemes, can help retail investors pick listed stocks in corresponding industry sectors. With long term growth visibility, a certain government support, retail investors with mid to long term investment horizon can selectively pick stocks to get good returns. Investors can make low risk, above average returns by participating in the government driven economy growth.
In the part 1 of this post series (link here), we covered the details of the PLI scheme, and the Auto Component sector. In this post, we will cover Automobile Original Equipment Manufacturers (OEM), and Aviation. We will develop a simple, stock picking framework – GEMS, and apply it to the OEM sector as an example. Let’s get started.
1. What is the PLI Scheme?
Production Linked Scheme (PLI) is a sales target based financial incentive scheme run by the Indian government. The intent is (a) Boost development in certain lagging sectors. (b) Encourage Make-In-India, which in turn will create jobs, and pave the path for future development and self-reliance of the country – India. PLI scheme allows Indian and foreign companies to apply for the incentive scheme, with the condition that the manufacturing should be done in India. The Indian government also benefits in the long run. The government benefits from increase in corporate taxes, exports taxes, income tax from newly salaried employees. The companies benefit from financial incentives from the government. It is a win-win situation. Similar incentive schemes have been adopted by different countries across the world, and India is not the first to do so. For a more detailed understanding of the PLI scheme details, you can refer to the Part 1 post in this series here.
2. Stock Picking Framework – G.E.M.S.
Starting with this post, and the remaining part of the PLI series, I will follow the GEMS framework to pick good stocks from the list of companies approved for the PLI scheme. Why the name GEMS? Well, because it fits well with the title of this post series :-).

GEMS framework stands for Growing Company, with Efficient Operations, good Management, available at Sale Price. This is a simple framework to enable retail investors like me pick stocks like a pro.
2.1 G of GEMS – Growing Company
A company which has been growing its topline (revenue) and profits, for the past 3 years, can be considered a growing company. I like companies who are consistent in growing their business. I am wary of companies who post a spike in revenue for a couple of quarters, then fizzle out. Hence, I will consider historical 3 years of performance to check consistency.
You may wonder what about cyclical stocks? Well – I am a long term investor, looking to invest with a time horizon of at least 3-5 years (and you should too have a similar investment horizon). Hence I will avoid stocks which are cyclical, with a cycle of less than 3 years.
As the PLI scheme is an incentive commitment from the government for the next 5 years, it suits my long term investment horizon. A good company will find a way to grow – organically or inorganically. A couple of quarters of poor performance should not hamper a consistent CAGR growth (Cumulative Accumulative Growth Rate) over 3 years.
An unfavorable macroeconomic trend has seldom lasted for more than a year. Subdued demand for a long time, leads to pent up demand, which leads to demand increase once the unfavorable macro-economic factor wanes away. For example – Covid lockdown led to reduction in travel, and negatively impacted tourism and hotel industry. Once the lockdowns were lifted after two years in 2022, the pent up demand led to multi-fold increase in tourism industry’s revenue.

In the G of GEMS framework, I am looking for companies who are consistently growing their revenue and profit over the past three years. As India’s GDP is growing around 5% annually, and inflation in India is also around 5% annually, I have kept a lower threshold of 10% CAGR growth in revenue as base cutoff. Companies with more than 10% revenue CAGR in the past three years are considered good.
Companies with less than 10% revenue CAGR will be evaluated in comparison with the industry sector revenue growth rate. If the company with < 10% revenue CAGR has performed better than its respective industry sector, I might still consider investing in this company given that its valuation is reasonable, given a lower growth rate. I will remove degrowing companies from investment consideration – companies with < 0% revenue CAGR.
2.2 E of GEMS Framework – Efficient Operations
Companies with efficient operations know how to raise and deploy capital. This is indicated by the technical indicator – ROCE (Return on Capital Employed). It is important for investors to check the ROCE of a company, as their capital (investors’ capital) will be deployed by the company to fuel future growth.
A high ROCE might also indicate a strong moat. Moat can come from exclusive license, technical expertise, economies of scale, or brand recognition giving the respective company a pricing power. A generic thumb rule is to consider companies with more than 15% ROCE. This is largely true, however this rule of thumb can be modified for each industry sector. Within an industry sector, a high ROCE vs industry average ROCE is preferred.
In addition to ROCE, the second indicator I will look for in Efficient Operations is Operating Margin (OPM). OPM tells us the profit margin before interest and taxes. A high OPM (>10%), indicates efficient operations which can scale. A low OPM requires a further deep dive to understand reasons for low OPM, whether it is raw material costs, employee costs, or inability to price the company’s products higher.

A combination of high ROCE and high OPM is a winning stock. ROCE and OPM should be looked at historically for at least three years, and not just for the recent quarter or financial year.
2.3 M of GEMS Framework – Good Management
An experienced and dedicated management is at the core of a great stock. Evaluating a company’s management is subjective. Hence I will restrict management evaluation to three indicators.
(a) Promoter Holding: A good manager will have skin in the game. This means that the promoter will be the largest shareholder in his/her company. Their wealth is tied to the stock price, and they are incentivized to work for their investors and generate wealth for themselves and their investors. Except banks, where promoters cannot have majority shareholding in the company, I consider >40% promoter holdings as good. Higher the promoter shareholding, the better it is.
(b) Promoter Holding Change: A very close second indicator of a good management is change in promoter holding. A consistent decrease in promoter holding over the past year, or two years, is a sign of worry. This means that the promoters themselves have lost confidence in future growth potential of their company, or their interest has wavered outside of the listed company. Vice versa, if promoter holding has been increasing over the past year or more, this indicates that the promoters are bullish on future growth of the company.
(c) Pledge Percentage: Promoters can pledge their equity holdings in the company in order to raise debt. This is not a preferred option of raising debt, and puts the promoter’s equity holdings at risk. This indicates that the promoter has exhausted other options of raising debt from banks and Private Equity companies. I consider a pledge percentage of > 10% a red flag, and will avoid such companies.
(d) Management Performance: This is a subjective indicator. This is a mix of years of experience in the industry, number of years the management has been with a company, and whether management has walked the talk. An industry experience of > 10 years gives comfort that the management knows what they are doing. Management pedigree (educational qualifications) also gives an indication of management performance. A good pedigree (IITs/NITs/BITs/IIMs/ISB etc.) is considered good, or a relevant industry degree (BPharm in Pharma/API sector) is considered good.

A combination of a, b, c metrics, and a subjective evaluation of d above will give an overall indicator of how good a management is.
2.3 S of GEMS Framework – Sale Price
Investors make money in the stock market by identifying well run businesses, and buying them at a discount. The last step, and equally important one, is to identify the fair valuation of a company, and only buy if it is available at a sale price. Key indicators for this are below:
(a) Price to Earnings (PE): PE, Price to Earnings multiple, is the most commonly understood and used parameter for valuation of a company. A high PE indicates expensive valuation, and vice versa. Even though PE standalone is not the only indicator, or the absolute right indicator of a stock’s valuation, we will use it in the GEMS framework because of its simplicity.
We will evaluate the current PE of a stock with its historical five year PE. This will tell us if the stock is trading above its historical median PE (expensive), or is trading at par with historical median PE (fairly priced), or is trading below its historical median PE (Sale Price !). Do note that we will NOT use absolute PE to decide if a stock is at a Sale price or not, we will use relative PE to do this.
A close second indicator is PE of a stock compared with Industry average PE. This gives an indication whether the stock is expensive relative to its industry peers.
(b) 200 DMA (Day Moving Average): 200 DMA tells the average stock price for the past 200 days. This tells us the momentum in the stock price. If the Current Market Price (CMP) is at par with 200 DMA, the stock has a neutral momentum. CMP above 200 DMA indicates overbought zone. CMP lower than 200 DMA indicates oversold zone, and a negative momentum. 200 DMA alone is not the only indicator of a stock valuation. A stock might be rerating upwards or downwards, causing it to go above or below its 200 DMA. 200 DMA, compared with PE will tell us whether the stock is available at a sale price or not.

Having defined the GEMS stock picking framework, let’s jump into identifying Automobile OEM stocks, approved in the PLI scheme in the next section.
3. Auto OEM Stock Picks
Under the Champion OEM Incentive Scheme, a total incentive of INR 26K Crore is allocated as incentives, to be given to OEMs over a period of 5 years, from 2022-2027. This incentive is based on meeting sales targets. Incentive eligibility criteria includes meeting minimum 50% local manufacturing in India, manufacturing of electric or hydrogen energy based vehicles, and meeting the sales targets as defined in the PLI scheme. Out of the 20 companies shortlisted for PLI scheme (refer Appendix 1), only 7 companies are listed on the stock market.
We will do GEMS framework analysis on these 7 companies next, and pick the top 3 Stock GEMS in the OEM sector! I will be using screener.in for all my analysis in this post. Do note that the Auto sector in India is just coming out of a down cycle, hence indicators of GEMS framework will show slow growth and less margins. However, we will also relatively compare these stocks as per GEMS framework to pick Auto OEM stock gems!
3.1 G of GEMs for OEM Sector
In Growing company analysis, we will look at Revenue and Profit growth of companies in the past 3 years. You can see this below for the 7 listed OEM companies.
| # | OEM | Revenue CAGR (3 Yrs) | Profit CAGR (3 Yrs) |
| 1 | Ashok Leyland Limited | 3% | -60% |
| 2 | Bajaj Auto Limited | 3% | 5% |
| 3 | Eicher Motors Limited | 2% | -9% |
| 4 | Hero MotoCorp Ltd. | -5% | -13% |
| 5 | Mahindra & Mahindra Ltd. | -5% | 7% |
| 6 | Tata Motors Limited | -3% | 0% |
| 7 | TVS Motor Company Limited | 7% | 2% |
This shows that most of the OEMs have not been growing in the past 3 years, which indicates a downward business cycle in the OEM sector. How should we shortlist companies for Growth? I will skip using G of the GEMS framework to pick OEM stocks, as all these companies are recovering from a down cycle.
3.2 E of GEMs for OEM Sector – Efficient Operations
To measure Efficient Operations, we will look at ROCE (average of past 5 years), and Operating Margin (average of past 5 years). We will give score as follows:
ROCE < 10% : Score 1
< 10% ROCE < 15%: Score 2
ROCE > 15%: Score 4

OPM < 5%: Score 1
5% < OPM < 10%: Score 2
OPM > 10%: Score 3
ROCE < 10% : Score 1
< 10% ROCE < 15%: Score 2
ROCE > 15%: Score 4
OPM < 5%: Score 1
5% < OPM < 10%: Score 2
OPM > 10%: Score 3
The efficient operations scoring table is as below. We see Bajaj Auto, Eicher Motors, and Hero Motorcorp scoring the highest in Efficient Operations.

3.3 M of GEMS for OEM Sector – Good Management
To evaluate Management of a company, we will look at Promoter Holding%, Change in Promoter Holding%, and Pledge %. Scoring will be done as below:
Promoter Holding between 0% to 40%: Score 1
Promoter Holding between 40% to 60%: Score 2
Promoter Holding > 6: Score 3
Promoter Holding decreasing: Score 0
Promoter Holding increasing between 0% to 1%: Score 1
Promoter Holding increasing between 1% to 5%: Score 2
Promoter Holding increasing > 5%: Score 3
Pledge % < 1%: Score 1

Pledge % between 1% to 10%: Score -1

Pledge % > 10%: Score -2
Promoter Holding between 40% to 60%: Score 2
Promoter Holding > 6: Score 3
Promoter Holding decreasing: Score 0
Promoter Holding increasing between 0% to 1%: Score 1
Promoter Holding increasing between 1% to 5%: Score 2
Promoter Holding increasing > 5%: Score 3
Pledge % < 1%: Score 1
Pledge % between 1% to 10%: Score -1
Pledge % > 10%: Score -2
Do note that I did not score on quality of management for OEMs, as all these companies are 40+ years old, and have good management running the company with vast industry experience.With this scoring, we see the top 3 OEM companies come out as Bajaj Auto, Tata Motors, and then a tie between Eicher, Hero, TVS Motors.

3.4 S of GEMS for OEM Sector – Sale Price
We will evaluate if the company is available at a sale price from Relative PE vs historical PE, Relative PE vs Industry PE, and Current Market Price of stock vs 200 Day Moving Average price. Scoring is done as below:
Relative PE vs Historical PE unavailable (as PE is -ve): Score 0

Relative PE vs Historical PE < 10%: Score 3

Relative PE vs Historical PE between 10% and 40%: Score 2
Relative PE vs Historical PE between > 40%: Score 1
Relative PE vs Industry PE unavailable (as PE is -ve): Score 0
Relative PE vs Industry PE < 0%: Score 3

Relative PE vs Industry PE between 0% and 40%: Score 2

Relative PE vs Industry PE between > 40%: Score 1

CMP vs 200 DMA < 10%: Score 3

CMP vs 200 DMA between 10% and 20%: Score 2

CMP vs 200 DMA >  20%: Score 1
Relative PE vs Historical PE < 10%: Score 3
Relative PE vs Historical PE between 10% and 40%: Score 2
Relative PE vs Historical PE between > 40%: Score 1
Relative PE vs Industry PE unavailable (as PE is -ve): Score 0
Relative PE vs Industry PE < 0%: Score 3
Relative PE vs Industry PE between 0% and 40%: Score 2
Relative PE vs Industry PE between > 40%: Score 1
CMP vs 200 DMA < 10%: Score 3
CMP vs 200 DMA between 10% and 20%: Score 2
CMP vs 200 DMA > 20%: Score 1
We see top 3 OEM companies having S score are Hero Motorcorp, Bajaj Auto, Mahindra & Mahindra.

3.5 Combining all GEMS score
We will combine all scores of the GEMS framework, to get the final score of the 7 OEM companies.

We see that based on the GEMS framework, the top three picks come out to be Bajaj Auto, Hero Motorcorp, and Eicher Motors. All these three companies are good companies, with established brands in India, and can be considered for investing.
One might wonder, why are big names such as Tata Motors, M&M are not scoring high. The reason is because the GEMS framework does not include the future growth outlook of these companies. As Tata Motors and M&M are investing heavily in the Electric Vehicle sector now, they will reap benefits in the coming years. I would actually consider investing in Tata Motors, and M&M, as both of them have significant share in India’s SUV market, and have built an entire ecosystem from car dealerships, post sale services, to car financing, to establish a strong moat in the Indian car sector.
To conclude, Stock Gems of OEM sector, purely based on technical indicators of the GEMS framework, the winners are:
Bajaj Auto

Hero Motorcorp

Eicher Motors

4. Aviation Sector Stock Picks
Drones are expected to become a close part of our lives in the future. From deliveries, to surveillance, data collection, the future of drones looks promising. The Ministry of Civil Aviation has allocated INR 120 Crore as part of PLI Incentive for Drone and Drone-part manufacturers. This incentive will be given on meeting sales thresholds, with 2021-22 as baseline year. The incentive will be rolled out over the next three years.
The PLI incentive is 20%, one of the highest in all of PLI schemes so far. The Indian Government has an ambitious vision to make India a global drone hub by 2030. To achieve this, apart from the PLI scheme, the government has made several reforms in this space. Some notable reforms are liberalization of Drone Rules, 2021; publishing of Drone Airspace Map 2021 which opens nearly 90 per cent of Indian airspace as a green zone up to 400 feet, UAS Traffic Management (UTM) policy framework 2021; Drone Import Policy, 2022 which bans import of foreign-made drones; and the Drone (Amendment) Rules, 2022 which abolishes the requirement of a drone pilot license for drone operations [Source: Economic Times article].
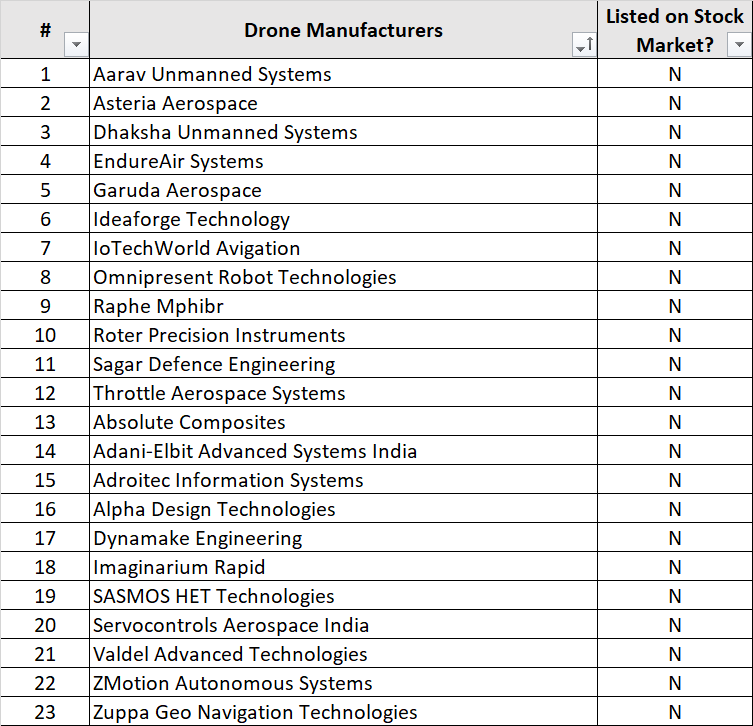
A total of 23 companies are shortlisted for the Drone sector PLI scheme. You can find these companies in Appendix 2. Unfortunately, none of these companies are listed on the stock market. Hence I will not be analyzing stock picks from the Drone sector in this post.
However, there are other listed companies working in the drone space. You can these companies from an investment fit perspective. Given the overall future growth potential in this sector, all well-run companies should benefit from favorable government reforms. Some listed companies working in Drone space are Hindustan Aeronautics Limited (HAL), Paras Defense and Technologies Systems, and Zen Technologies.
I hope you are now able to do a quick technical analysis of a company using the GEMS framework. In the next part of this series, we will analyze Chemicals, Electrical Systems, and Food Processing sectors benefiting from the PLI scheme.
Which Automobile company is your favorite? How does it score in the GEMS framework? Comment below.
Happy Investing!
Appendix 1: PLI Scheme Winners – Original Equipment Manufacturers (OEM)

Appendix 2: PLI Scheme Winners – Drones and Drone Parts Manufacturers


Pingback: Picking Pharma stocks based on PLI Scheme - Mayank Dwivedi
Pingback: 3 Wrong Reasons to Hate a Stock - Mayank Dwivedi
Pingback: How to make INR 12Lac passive income annually - Mayank Dwivedi