
0. What is this post about?

Stock investors like high returns with minimum downside (risk). In stock market terms, this translates to high alpha and low beta. Often, the conservative investors choose the largest company (by market capitalization) in an industry sector to achieve their objective – stable returns with low risk. And the aggressive investors choose small caps in an industry sector, assuming higher rate of returns vs large caps.
This investment decision of conservative and aggressive investors is based on two assumptions. First, large cap stocks are relatively stable, and less risky. Second, small Cap stocks will give higher rate of returns as they grow to become mid-cap and then large-cap stock in the future. Both these assumptions are more often than not – inaccurate.
But do you know, there is a better option for both conservative and aggressive investors? This option is to choose the second largest company (or third largest company) in an industry sector. This can be a better stock pick, giving higher returns with minimum downside? We will explore this investment approach in the following post. Let’s get into it.
1. Why pick the Second/Third Largest company in a sector?
The second or third largest company have the following advantages over the largest company. This advantage is reflected in stock price growth:
1.1 Lower expectations, better wow factor
If the largest company, and the second largest company, both grew their revenue by same percentage year on year, the second largest company will wow the investors and analysts, more than the largest company. Generally, there is lower expectation from the second largest company, vs the largest company.
Analysts are waiting for the largest company to degrow. These analysts are eager to write an article titled: “Is the downfall of XX company in sight”. These same analysts are waiting for the second largest company’s performance to outpace the largest company, to publish an article titled: “The emerging bluechip company YY in the ZZ industry sector”. The “underdog” effect helps the second or the third largest company’s price rise faster, on achieving industry average performance. It is human nature to seek the fall of the largest (the “bully”), and the rise of an underdog. After all, maintaining the top position is harder than getting to that top position.
1.2 More room to grow

The largest company is like a whale in a pond, with less room to grow further. Whereas, the second largest company is a small fish in a pond, with more room to grow, and eat into the market share of the industry sector it is in. This future expectation of more growth potential helps the second/third largest company’s price rally more, than the largest company.
1.3 More Nimble
A large company is like a giant python, and takes time to change direction. New initiatives take time to be tested and deployed. On the other hand, the second/third largest companies are like a swift cobra, changing direction swiftly, and always hungry for more growth.
1.4 PE Catch Up
Sometimes, we see that the second/third largest company in an industry sector has lower PE, as compared to the largest company in that sector. Owing to this, the market typically increases the PE of the second/third largest company, giving it the same valuation as the largest company. This phenomenon is also known as PE expansion. This leads to relatively more stock price growth for the second/third largest company, vs the price growth of the largest company. The vice versa is also true, called PE contraction (or PE de-rating), where a higher PE of the large cap stock reduces to match the industry average PE.
2. Why to NOT pick the Second/Third Largest company in a sector?
It is not always hunky dory for the second/third largest company in a sector. Below points are advantages that the largest company holds, which may deter growth, and stock price appreciation of other companies in the same sector.
2.1 Economies of Scale
Large companies achieve economies of scale. This means that, as they grow in size, the cost of production + distribution decreases per unit of product sold. This is owing to the fact that fixed costs get distributed across a large amount of units of products.
Scale also brings in optimization of supply chain, higher utilization of machines/plants/transport vehicles etc. These all factors contribute to cost advantage for the largest company. The second/third largest company may or may not have achieved these economies of scale, hence may have a higher cost of production/distribution.
2.2 More Bargaining Power with Suppliers
Owing to their size, large companies may demand a higher discount from their suppliers. These companies can sign long term contracts, fixing a lower price. Large companies may also demand a preferential supply priority in case of supply shortages. Suppliers are inclined to provide discounts and priority to large companies owing to the large amount of order contracts, and stable future orders they get from these large companies. Smaller companies may not be able to do so.
2.3 Attract Top Talent
Large companies are able to attract top talent in the market. Large companies can pay higher salaries, and get access to first day placement in top tier colleges to recruit talent. Smaller companies may have to sell their company prospects to top talent to attract them, and may find it harder to recruit than large companies.
2.4 Easier access to finance
Larger companies find it easier to raise money. Owing to their renowned brand name, and size, banks are more comfortable lending money to larger companies. Smaller companies will find it relatively harder to raise money from banks.
We see that the largest company definitely has some advantages over the smaller companies. However, these may be nullified by the smaller companies who are more agile to adapt the newer trends in the market. Or, the smaller companies may still be large enough to enjoy the same advantages that the largest company enjoys.
Now, let’s get into different industry sectors to see the returns of the largest and the second/third largest company in the past five years.
3. How have the Second/Third largest companies fared vs the Largest Company in the Indian Stock Market
We will look at five industry sectors to compare returns from the largest vs the second or the third largest company in the sector. These examples are chosen to show you that when a midcap/small-cap stock in an industry is well picked, then these stocks outperform the large cap stock in the same industry sector, even when showing a similar or lower revenue growth.
We will look at past 5 years, and past 3 years Stock Price CAGR, Sales Growth CAGR, Profit Growth CAGR. 5 years vs 3 years CAGR helps us compare historical vs more recent trends in the stock performance. This analysis is done in April 2022, using Indian stock screener screener.in.
3.1 Fast Moving Consumer Goods (FMCG)
FMCG sector includes daily use items, from personal care to packaged food items. FMCG sector in India is expected to grow at 15% CAGR between 2020 to 2025 (Reference: https://www.ibef.org/industry/fmcg). Let’s compare three listed FMCG stocks: (a) The largest FMCG company: Hindustan Unilever (HUL)- market cap of INR 506K crore (b) The second largest FMCG company: Nestle (market cap of INR 177K crore); and (c ) A well run small cap FMCG company: Amrutanjan (market cap of INR 3K crore).
Comparison of stock price growth, profit growth, sales growth, and PE is below.
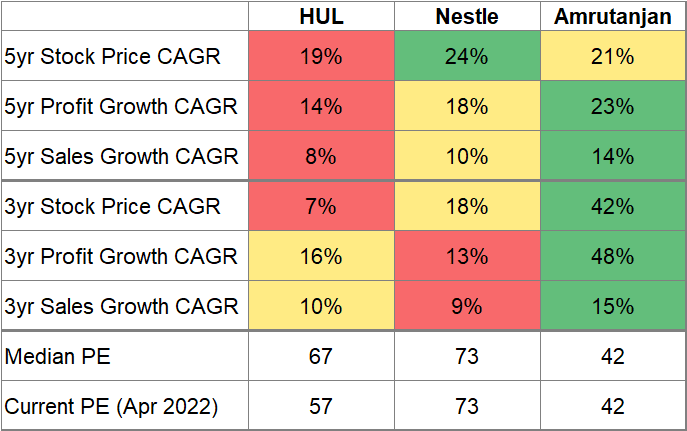

Hindustan Unilever (HUL): HUL stock is slowing down. Its sales grew at 8% CAGR in the past 5 yrs, and 10% CAGR in the past 3 yrs. HUL’s profit growth is increasing, which might indicate pricing power of this large cap behemoth, and better negotiation power on raw materials and distribution channels.
Now onto the most worrying sign, HUL stock’s CAGR is decreasing with time. HUL stock gave 19% CAGR return in the past 5 years. However, it gave only 7% CAGR returns in the past 3 years. HUL’s PE is decreasing over time, indicating PE contraction.
Why is this happening? HUL is the largest FMCG company in India. It has an established brand, and pricing power. Why is HUL stock price not rallying despite its revenue consistently growing?
Well, the room for growth for HUL is lesser compared to other smaller FMCG companies. The next lever which will unlock value for HUL, rural demand growth, is currently subdued/unclear as in 2022.

Nestle: Nestle’s sales growth is consistent at 10% CAGR over the past 5 years. Its profit growth rate has declined over the last 5 years, even though it is increasing at 18% CAGR, which is a faster growth rate than the sales growth rate.
A higher profit growth rate over sales growth rate indicates economies of scale in play. Now onto the main metric – returns. Nestle’s stock investment return is higher than HUL. Nestle gave a CAGR return of 24% over the past 5 years, and a CAGR return of 18% over the past 3 years. This return is more than HUL’s return on stock price for the same time period. The PE of Nestle is relatively stable, indicating that the market believes in the future growth potential of the company. Nestle’s PE might be more than HUL’s owing to the premium segment of chocolates and coffee it operates in.
Amrutanjan: Amrutanjan, being a small cap stock, is growing at a fast rate. Its sales grew at a CAGR of 21% in the past 5 years, and at a CAGR of 42% in the recent 3 years. Amrutanjan’s profit growth rate is high, growing at a CAGR of 23% in the past 5 years, and at a CAGR of 48% in the past 3 years.
This means that Amrutanjan is growing faster in recent years, vs 5 years back. This can be attributed to a new category launched by Amrutanjan in the women’s hygiene category. Now, onto the main metric, stock price return. Amrutanjan created wealth for their investors at a CAGR of 21% in the past 5 years, and at a whooping CAGR of 42% in the past 3 years.
In terms of investment returns in the past 3 years alone:
Amrutanjan (48%) >> HUL (16%) > Nestle (13%)
Considering a longer stock price returns of past 5 years, we get:
Nestle (24%) > Amrutanjan (21%) >> HUL (19%)
This shows that in terms of investment returns, the largest company fared worse than the second largest company. The largest company even lagged behind the small cap company in the same sector (FMCG).
Does this mean the largest company (HUL) is a bad investment choice to get returns in the future?
Well, No! HUL will continue to grow, as the entire FMCG sector is growing. The rural sector in India is yet to adopt the many brands sold by these FMCG companies. However, the growth rate of HUL will be lesser than that of small-cap but well run FMCG companies such as Amrutanjan. If I were to pick just one FMCG stock in April 2022, considering investment returns, I would pick Amrutanjan over HUL. A close second pick will be Nestle.
3.2 Alcoholic Beverages
Alcoholic beverages sector includes companies who sell alcohol – either their own brands, or international brands under license in India. We will compare the largest alcoholic beverage stock in India – United Spirits (market cap of INR 65K Crore), with two upcoming small-caps: Radico Khaitan (market cap of INR 12.5K Crore) and Globus Spirits (market Cap of INR 4.5K Crore). Do note that I have not taken the second largest alcoholic beverage stock, which is United Breweries (market cap of INR 40K Crore). The reason is United Breweries is an average performing stock with non index beating returns.
Comparison of stock price growth, profit growth, sales growth, and PE is below.
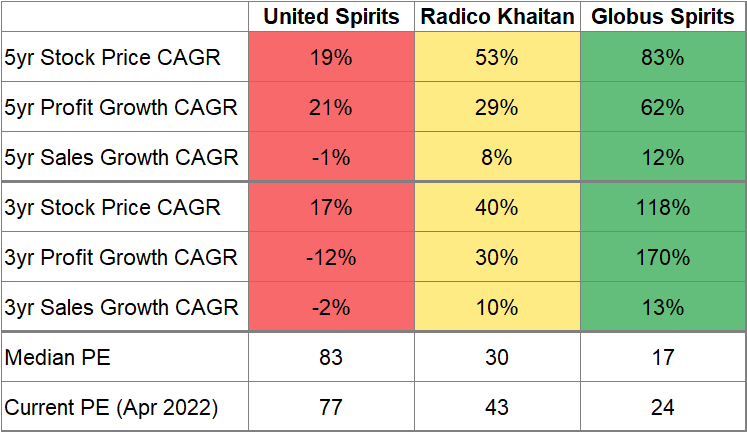
United Spirits: This large cap stock is in its mature/decline phase. Its sales have been declining in the past 5 years (-1% CAGR). Its profit has been declining in the past 3 years (-12% CAGR). The PE is declining as well (historical median PE of 83 vs current 2022 PE of 77).
United spirits did a great job at bringing foreign branded alcohol to the Indian market such as Johnnie Walker. However, it missed on the rising trend to consume Indian branded liquor. Even though United Spirits’ stock price has given index beating returns over the past 5 years, it may not continue to do so in the future.
Radico Khaitan: This small cap stock has given 53% CAGR returns to investors in the past 5 years. Its sales has grown at 8% CAGR over the past 5 years, indicating that it is eating away the share of large cap stocks in the sector such as United Spirits.
Radico’s PE is expanding, increasing from historical average of 30, to current 2022 PE of 43. Its Indian made liquor brands such as 8pm, Rampur whiskey, and Magic Moments are popular brands among Indians. This stock is a definite one to watch out for, as it expands into new brands and states in India.
Globus Spirits: Say hello to the recent multi-bagger stock of FY 2021-22. Globus Spirits has given 118% CAGR returns in the past 3 years (has become 3.5 x – multi-bagger alert). Its revenue has grown at a CAGR of 12% in the past 5 years.
Its PE is expanding, increasing from historical average of 17 to currently 24 in 2022. This PE expansion may happen further to around 30-35 levels on a conservative side. This is the PE range allocated to other leading small caps in this sector.
In terms of stock investment returns in the past 5 years:
Globus Spirits (83%) >> Radico Khaitan (53%) >> United Spirits (19%).
As drinking alcohol becomes more acceptable in India, demand for Indian made liquor will grow. Radico Khaitan and Globus Spirits are well placed to take advantage of the alcohol industry growth in India in the coming years. I would invest in Radico Khaitan and Globus Spirits on dips, and avoid investing in United Spirits.
3.3 Information Technology (IT)
India has led the IT industry sector for over a decade now. Availability of low cost IT engineers, and the industry wide tailwind to drive digital transformation around the globe, Indian IT sector has boomed, and there are no signs of slowdown.
We will compare the largest Indian IT company – Tata Consultancy Company (TCS) – market cap of INR 1354K crore, with a mid-cap IT stock – Coforge (market cap of 25K crore), and a small cap IT stock – Intellect Design Arena (IDA) with a market cap of INR 12K crore. Do note that I have not taken the second and third biggest IT stocks, namely Infosys and Larsen & Toubro Infotech (LTI), as I plan to compare large cap vs midcap vs smallcap in the IT sector. However, a TCS vs Infosys vs LTI will also tell you that investment in Infosys or LTI has given higher returns than TCS.
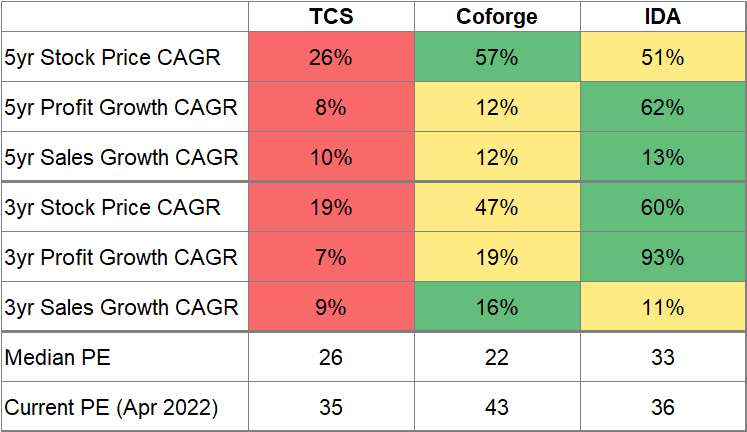
TCS: The IT behemoth has given index beating returns of 26% CAGR in the past 5 years. However stock price growth rate is declining recently, which reduced to 19% CAGR in the past 3 years. This is indicated by slowing sales growth rate, which decreased from 10% CAGR in the past 5 years to 9% CAGR in the past 3 years.
However, we see PE expansion in TCS, with PE increasing from historical median of 26 to 35 in 2022. PE expansion is common among all IT stocks. The reason is that IT is a sunrise sector, which will grow more than India’s GDP over the next 5 years.
A second factor is that Nifty IT index (indicator of IT stocks’ listed on the National Stock Index), has run up quite a lot in 2020-2022. This led to higher PE allocation to IT stocks in India. Many analysts expect a correction/consolidation of Nifty IT index going forward in H2 2022. This correction will bring back the elevated PE to reasonable levels.
Coforge has been expanding its global footprint in recent years, via acquisitions such as SLK Global solutions, and by strengthening its footprint in Western Countries – US, UK, Europe. Coforge provides software solutions in the AI/ML space, with multi-lingual and multi-channel options – expanding the scope of its applications, and operating in a fast emerging sector driven by AI and big data.
Coforge’s sales have grown faster than large cap IT stocks. Its sales CAGR in recent 3 years stands at 16%, higher than 5 years sales CAGR of 12%. Coforge’s stock price returns are more than double that of the large cap stock – TCS. Coforge stock has given returns to the tune of 57% CAGR in the past 5 years. Being in a sunrise sector, an established and growing global footprint, investors can get on-board the Coforge bandwagon for a rewarding ride into the future.

Intellect Design Arena (IDA): The digital transformation specialist in the Banking and Financial Service sector – Intellect Design Arena. This Chennai based small cap company has been slowly, but consistently winning long term deals with national banks across the world, to digitize their banking and payment systems.
Recently in Mar’22, Reserve Bank of India selected IDA to upgrade its cloud banking solution, reinforcing the trust companies place in IDA. IDA’s revenue has grown at 13% CAGR in the past 5 years, the highest growth rate among TCS, Coforge, and IDA.
IDA has given its investors eye-popping returns at the rate of 51% CAGR in the past 5 years. IDA faces competition from other IT companies who are in the BFSI segment. However IDA has specialized focus on the BFSI segment, making it the preferred choice for a bank. Long term contracts, diversification across the globe, makes IDA a good stock to invest in.
In terms of stock investment returns in the past 5 years:
Coforge (57%) > IDA (51%) >>> TCS (26%).
3.4 Other Sectors
I hope you get the point. As long as you are picking a fundamentally good company, with a good past record of delivering company strategy, and keeping away from management frauds, a small cap or midcap stock in a sector can give higher returns than the large cap stock. I have taken two more sectors to give you examples from: Banking, Infrastructure.
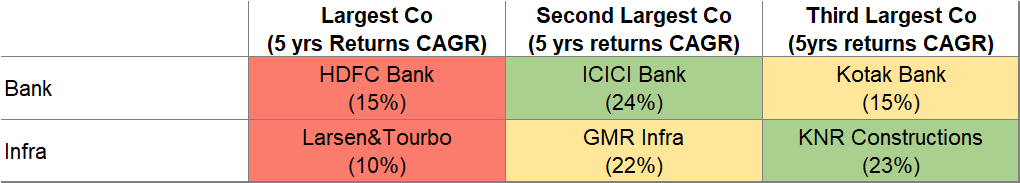
As you see, in banking sector, the second largest bank has given better returns in the past 5 years than the largest bank:
ICICI Bank (24% CAGR returns) > Kotak Bank (15% CAGR returns) ~ HDFC Bank (15% CAGR returns).
Same for the infrastructure/construction sector, GMR Infra and KNR constructions have given much higher returns than the largest construction company – Larsen & Toubro.
KNR Constructions (23% CAGR returns) > GMR Infra (22% CAGR returns) >> L&T (10% CAGR returns).
4. Will the largest company always give lower returns than rising industries in the same sector?
No!
There are exceptions.
For example: in the specialty chemicals sector, the largest company Divi’s Labs. Divi’s Labs has given maximum returns as compared to other midcap stocks in the same sector.
Divis Labs (48% CAGR returns in 5 years) > Laurus Labs (42% CAGR returns in 5 years) > Aarti Industries (38% CAGR returns in 5 years).
In the cement sector as well, we see the largest company beating the second and the third largest company:
Ultratech Cement (11% CAGR returns in 5 years) > Ambuja Cement (9% CAGR in 5 years) > Shree Cement (7% CAGR returns in 5 years).
I plan to do another blog post on the situations where the largest company is the best investment bet. However, to understand this with a simple rule, if a stock is a monopoly or duopoly in an industry sector, then investing in it is the best bet. Example: It sounds unlikely that sometime soon there is going to be another Apple in the smartphone market. Or another Amazon.com in the ecommerce sector. These monopolies show long term growth owing to multiple factors. Factors such as huge first mover advantage, loyal customer base, constant innovation, expansion by mergers and acquisitions, and network effect.
Hence, for monopoly stocks, the rule of getting higher investment returns by investing in the second or third largest company may not be true – but worth evaluating. The second best large cap/mid-cap/small-cap stock, if run by a good management, can still give disproportionate returns in the short to mid term (3-5 years).
5. Parting thoughts
How one picks and invests stocks is a personal decision. This blog post attempts to provide insight into getting higher returns by investing in a well run, fast growing mid-cap or small-cap stock in an industry sector. This post also demystifies the notion that investing in the largest company in the industry sector is always the right form of long term investing. The factors which make a company monopoly itself can change over time. The underdog company has an advantage in terms of more room for growth, nimbleness, and hunger for faster than industry average growth.
A retail investor should do his/her own research before investing. Finding a well run company in an expanding or consolidating industry sector is the first step. Once you have crossed this step, and identified the industry sectors and companies to evaluate, then you can compare the largest company in the sector vs other mid-cap/small-cap companies in the sector.
Which sector did you analyze? Did the largest company in this sector gave less, same, or more returns than upcoming companies in this sector? Share in the comments below.
Happy investing!
Disclaimer: This post is not an investment advice. Please do your own research before investing.


Pingback: Past Multi Bagger Stock, a Future Multi-Bagger Stock?