1. Why a Core and Satellite Portfolio?
Wealth is generated in the stock market by long term investing. Patient investors invest wisely, take calculated risks, and continue to water their flowers while plucking their weeds in time. Many mutual funds have an approach of creating a portfolio of stocks, that is time-tested, and generates index beating returns, with a downside protection. This approach is called the Core and Satellite stock portfolio approach.
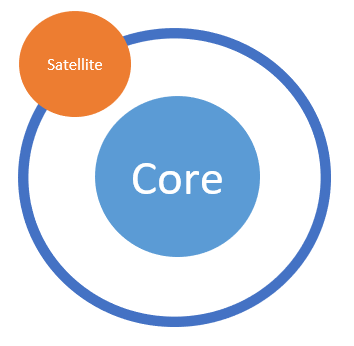
Core and Satellite style of portfolio creation selects a core portfolio of stocks which has low risk (low beta), giving average to above average index returns. This is combined with a satellite portfolio of stocks. Satellite portfolio stocks are high risk and high reward stock bets.
Core and Satellite portfolio is in no way a get-rich-quick scheme. However, this portfolio creation approach is good for long term investors, who do not have time to track the stock market daily. In this post, I will get into details of what Core and Satellite stocks are. I will also create a sample Core and Satellite stock portfolio to give you an idea of how to go about creating one. Let’s get started.
Disclaimer: This post is not investment advice, please do your own research before making an investment decision.
2. The Core Part of Portfolio
2.1 Characteristics of a Core Portfolio
(i) Market Cap > INR 10,000 Cr
We will look at large companies, with more than INR 10K Cr market capitalization. This will ensure that we are looking at large cap, and mid-cap companies. Small cap companies can be selected as part of the Satellite portfolio (covered in section 3). Large market cap ensures stability, and less risk of the company going bust overnight.
(ii) Consistent Compounder
The core portfolio stock should be a consistent compounder. This means that the company’s top line (revenue) should be increasing year on year, for at least the past five years. Company’s profits should be increasing year on year for the past five years. Company should be efficiently run. Company’s Operating Margin should be stable or growing over the past five years. Company’s Return on Equity should be stable or increasing over the past years.
Combining these technical indicators, we will be able to shortlist a set of stocks which are consistently growing, and show potential of growing into the future as well. A couple of quarters of bad performance will not reflect in the yearly performance of the company. Hence, I have restricted the technical indicators analysis to year over year, for at least the past five years.
(iii) Stock Returns > Nifty Index Returns
This criteria ensures that the stock we pick gives average returns when compared with Index (Nifty 50 index gives ~ 14% returns annually). To create a more aggressive (higher returns) core stock portfolio, you can include industry average returns, which means that the stock has performed at par or better than the Industry Index.
Example, IT stocks to be compared with Nifty IT index, an FMCG stock to be compared with Nifty FMCG index. This will compare the stock’s performance with its peers in the same industry. A stock which is beating index, or beating its Industry Index, is a high growth stock to put in your Core portfolio.
(iv) Low Beta
Less than one beta ensures downside protection. Usually large cap stocks have less than one beta, as they do not fall as much as the index falls during a correction, or a bear cycle. Low beta stocks are less risky, and more stable. They will go down less as compared to the index during a downtrend, and go up less as compared to the market during an uptrend.
(v) Minimum 5 years History on Stock Market
This criteria ensures there is at least five years or more of audited financials of a company for analysis. It is difficult to analyze newly listed companies from a long term growth perspective. Post IPO, a company’s management, style of running the company, capital allocation etc. are public. This provides more data points for investment analysts to review and comment on a company’s quality in terms of future strategy vision, company culture, management strength, and astute capital allocation.
Running a company well post IPO is a different ball game. A company which has understood the nuances of a public company, from answering investor calls, facing critique publicly from investment analysts, and still able to walk the talk on their yearly strategy – is a company which has stood the test of time, and ripe for our analysis for a core portfolio pick.
2.2 Creating a Sample Core Stock Portfolio
Now, let us get to the fun part. Creating a sample Core Stock Portfolio, by applying each of the criteria above. I will write these criteria as rules, so that you can use them in any screener tools of your choice. I am using screener.in, and tickertape.in for my analysis. This analysis was done in Jun’22.
Step 1: More than INR 10K Cr market capitalization
Screener:
Market Capitalization > 10000
On applying this on screener.in, we shortlist ~ 350 stocks, from over 4.5K stocks listed on NSE
Step 2: Consistent Compounder
Growth rates used in screener are an average company’s growth rate.
Sales Growth Rate: > 5% CAGR for past 5 years
Profit Growth Rate: > 5% CAGR for past 5 years
Operating Profit Margin: > 10% for past 5 years
Return on Equity > 10% for past 5 years
Screener:
Sales growth 5Years > 5 AND
EPS growth 5Years > 5 AND
OPM 5 Year > 0 AND
Return on equity > 10
Applying this filter shortlists stocks further, reducing the stocks’ list count by half, from 350 in step 1 to 160 after step 2.
Step 3: Stock Returns > Index average returns
There is no straight formula to get industry average returns.
As Nifty 50 index has given average 14% returns in the past 5 years as on May ’22, we will apply a screener filter to filter those stocks who have given at least 14% CAGR returns in the past 5 years.
Cumulative Screener Query:
Market Capitalization > 10000 AND
Sales growth 5Years > 5 AND
Profit growth 5Years > 5 AND
OPM 5Year > 5 AND
Return on equity > 10 AND
Return over 5years >= 14
This reduced the list of stocks by half again, from 160 in step 2 to 80 in step 3.
Step 4: Beta less than 1
Cumulative Screener Query:
Market Capitalization > 10000 AND
Sales growth 5Years > 5 AND
Profit growth 5Years > 5 AND
OPM 5Year > 5 AND
Return on equity > 10 AND
Return over 5years >= 14 AND
Beta < 1
This reduces the shortlist by approximate ⅓, from 80 in step 3 to 27 in step 4.
Step 5: IPO Date > 5 years back
Cumulative Screener Query:
Market Capitalization > 10000 AND
Sales growth 5Years > 5 AND
Profit growth 5Years > 5 AND
OPM 5Year > 5 AND
Return on equity > 10 AND
Return over 5years >= 14 AND
Beta < 1 AND
IPO Year <= 2017
Hygiene Step 1: Sane Valuations. I will remove companies with more than 100 PE from this list, in order to avoid in-explainable valuation.
Core Portfolio Stock Picker screener

Market Capitalization > 10000 AND

Sales growth 5Years > 5 AND

Profit growth 5Years > 5 AND

OPM 5Year > 5 AND

Return on equity > 10 AND

Return over 5years >= 14 AND

Beta < 1 AND

IPO Year <= 2017 AND

PE < 100
Final Core Portfolio
Sort the final 26 stocks in descending order of Market Capitalization, and pick just one stock in each sector, the first stock in an industry sector you encounter from top down. This is your Core Stock Portfolio !
Below is what it looks like as on Jun’22.
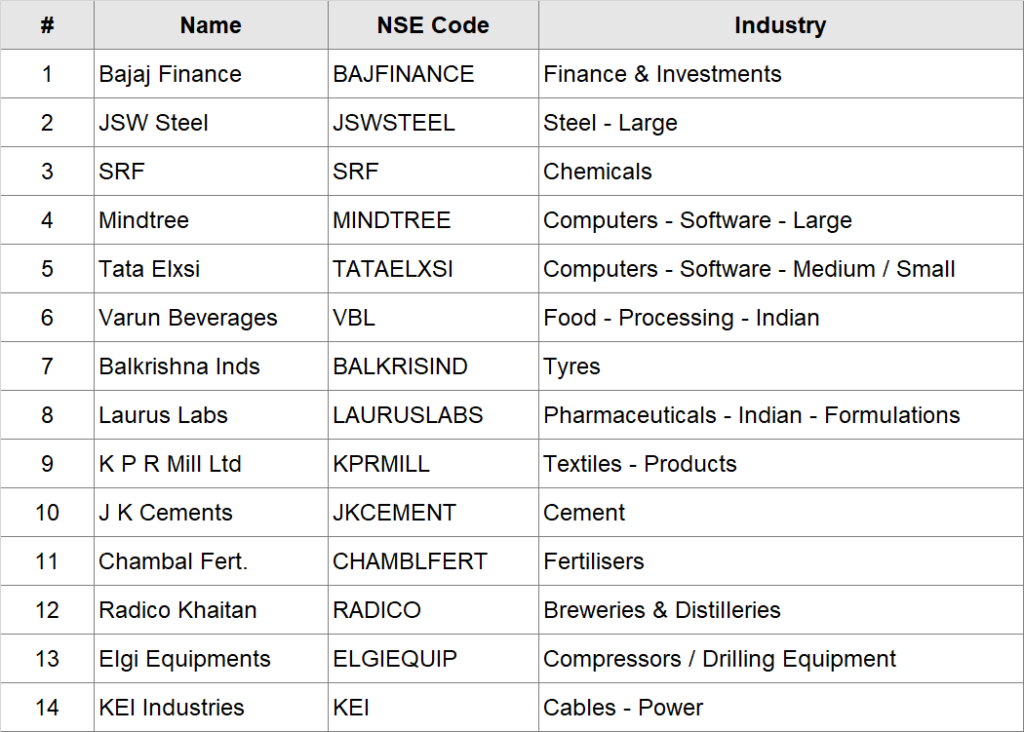
We have created the Core part of the portfolio, which will give stable, and Nifty 50 index average returns, with less volatility. Now, I will move to the fun part of high risk and high reward stocks. Let us create the Satellite Stock Portfolio.
3. The Satellite Part of Portfolio
3.1 Characteristics of a Satellite Stock Portfolio
(i) Market Capitalization
We will look at small cap companies, with market capitalization more than INR 500 Cr, but less than INR 10,000 Cr. This will ensure that we stay away from micro caps (< INR 500 Cr market capitalization); and also not enter the core part of the portfolio we created in section 2 (< INR 10,000 Cr market capitalization). We are avoiding micro cap stocks as these might be volatile, and are too small to confidently predict their future growth potential.
(ii) Fast growing company
If core portfolio stocks are consistent compounders, then satellite portfolio stocks should show high growth rate in the recent past (3 years historically). This will justify taking a bet on these stocks, in expectation of index beating future returns.
Technical indicators for fast growth are Sales Growth in the recent four quarters > 10% CAGR, Profit Growth in the recent four quarters > 5% CAGR, Operating Margins > 10%. A 10% topline growth year over year is considered a fast growth here, which is more than the average India’s GDP growth rate of 6-7% annually.
I have included a counter balancing metric of profitability growth as well, to ensure that the company’s profits are growing with the top line growth, with a healthy operating margin of 10% or more.
(iii) Healthy Financials
The company should have healthy financials. This is indicated by increasing free cash flow year over year, increasing earnings per share year over year, and above average return on capital employed (ROCE), and low Debt to Equity ratio.
Increasing free cash flow indicates that the company has more free cash each year to deploy into the company’s future growth. Increasing Earning Per Share means increase in shareholder value. High return on capital employed means efficient deployment of capital by company’s management to generate high returns. Lower debt as a ratio of equity indicates that the company is not debt ridden, which is a risky indicator. Debt should always be less than the total equity value of a company. A healthy Debt to Equity ratio is < 0.5. A debt to equity of more than 1 is risky.
(iv) Attractive Valuations
If we want to make more than index average returns, we need to buy low and sell high. To achieve this, we will use valuation indicators. The first is, the Price to Earning (PE) of the stock should be less than the Industry Average PE. This indicates that the stock is not yet noticed by the institutional investors, and is trading at lower than the PE of that industry.
The second indicator is Price to Earnings to EPS growth ratio, or PEG ratio. PEG ratio is used to standardize the PE ratio, with future EPS growth rate of the company. A PEG ratio of less than one is considered an attractive valuation.
(v) Positive Price Momentum
A growing stock, with expected good returns, will have some price momentum baked into it. Positive price momentum can be determined if the stock’s 50 Day moving average price is more than the 200 day moving average price. This indicates positive price momentum in the stock price, with average stock price moving upward over time.
(vi) High Alpha (higher returns)
In satellite stock portfolio, we are looking for higher than index average returns. The indicator to determine this is Alpha, which provides the percentage by which a stock returns exceeds the index returns. For our portfolio, we will consider 10% higher than index returns in our satellite stock screener. Alpha value of 1 indicates 1% higher returns than index. Hence, Alpha value of 10 indicates 10% more returns than index.
You would have noticed that there are more filters in the satellite stock portfolio. This is expected, as stock portfolio will only consist of 20-30% of your overall stock portfolio, and the other 80-70% of your portfolio will be the core stock portfolio. This also means that you may have to rebalance the satellite part of your portfolio every month. Whereas the core part of your portfolio can be rebalanced (revised) every quarter, as the core stocks are expected to be less volatile, and slow moving stocks.
3.2 Creating a Sample Satellite Stock Portfolio
Now, I will create a sample Satellite stock portfolio, by applying each of the criteria above. I will write these criteria as rules, so that you can use them in any screener tools of your choice.
Step 1: Marketcap between INR 500 Cr to INR 10,000 Cr
Screener:
Market Capitalization > 500
On applying this on screener.in, we shortlist ~ 940 stocks, from over 4.5K stocks listed on NSE.
Step 2: Fast Growing Company
Screener:
Sales growth > 10 AND
Profit growth > 5 AND
OPM > 10
Applying this filter shortlists stocks further, reducing the stocks’ list count from 940 in step 1 to 430 after step 2.
Step 3: Healthy Financials
Screener:
Free cash flow preceding year > Free cash flow last year AND
EPS > EPS last year AND
Average return on capital employed 3Years > 15 AND
Debt to equity < 0.5
Applying this filter shortlists stocks further, reducing the stocks’ list count from 430 in step 2 to 50 after step 3.
Step 4: Attractive Valuation
Screener:
Price to Earning < Industry PE AND
PEG Ratio < 1
Applying this filter shortlists stocks further, reducing the stocks’ list count from 50 in step 3 to 20 after step 4.
Step 5: High Alpha
Screener:
Alpha > 10
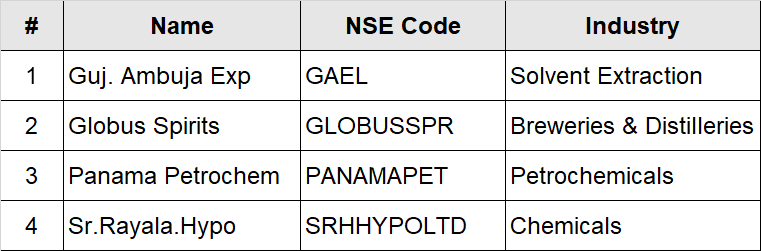
Applying this final filter shortlists stocks further, reducing the stocks’ list count from 20 in step 4 to 4 after step 5.
Satellite Portfolio Screener Query

Market Capitalization > 500 AND

Market Capitalization <= 10000 AND

Sales growth > 10 AND

Profit growth > 5 AND

OPM > 10 AND

Free cash flow preceding year > Free cash flow last year AND

EPS > EPS last year AND

Average return on capital employed 3Years > 15 AND

Debt to equity < 0.5 AND

Price to Earning < Industry PE AND

PEG Ratio < 1 AND

DMA 50 > DMA 200 AND

Alpha > 10
The final four stocks after applying satellite stock screener above are:
4. Summary
4.1 Core and Satellite Stock Portfolio
Hope you got the concept of the core and satellite stock portfolio creation approach. The core portfolio provides you a solid foundation, with low risk and average returns from the stock market. As Warren Buffet says – “There are two rules of investing. Rule 1: Do not lose money. Rule 2: Do not forget rule 1.”
The core part of your portfolio will help you preserve capital, and not lose it. Large companies, who have shown consistent growth in the past, will rarely go bust overnight. You should allocate three fourths (75%) of your portfolio to the core stocks.
The remaining one fourth (25%) of your portfolio can be risky bets you want to take – the satellite stocks. In the satellite part of your portfolio, some stocks may underperform and may lead to loss of your capital as well. However, it is expected that some stocks in your satellite portfolio will overperform, hence will more than compensate for the underperforming stocks.
4.2 When to rebalance?
You can rebalance this stock portfolio every month by re-running the core and satellite stock screeners. Core part of your portfolio is expected to churn at a lower rate, than the satellite part of your portfolio.
You should feel free to experiment with the satellite stocks, and add some stocks on which you are confident on, but do not show in the satellite stock screener mentioned in section 3 above.
You should do a fundamental analysis of the stocks screened via core and satellite stock filters mentioned in this post. The filters mentioned in this post is a guide, and does not guarantee an index beating returns from these stocks. However, if you follow a core and satellite stock portfolio creation approach, it is highly probable that you will get more returns than what you would get by investing in the market index.
Which stocks do you think are a good fit for Core Portfolio, and which stocks for Satellite portfolio? Do mention in the comments below.
Happy investing!


Pingback: How to create a Diversified & Concentrated Stock Portfolio - Mayank Dwivedi
Pingback: The Two Minute Rule to buy stocks at right price - Mayank Dwivedi
Pingback: Mutual Fund Vs Pms Vs Self Investing | Best High Return Mutual Funds