
What is the Fuss?
Business, is about selling well the product or service you offer. All businesses do it. This has to be backed by quality product or service offered, else customers will churn. Banks and NBFCs (Non Banking Financial Company) are no different. Banks and NBFCs exist on people’s trust. This trust is often passed on from generations, from parents to children. And this trust makes it hard for retail investors like us to read between the lines.
In this post, I make the returns from Fixed Deposits (FD) offered by Banks and NBFCs more transparent. These are things that these financial companies never tell you, at least not upfront. Not in their marketing notifications, or ad banners. Banks just ask you to deposit money in their FD, calling it safe, and offering high interest income. Yes, it is safe, but the returns is where it gets less transparent.
In this post I will compare some Banks and NBFCs, and also tell you the one which gives the highest ‘real’ FD returns.
I am sure after reading this post, you will start looking deeper at the FD offerings from banks and other financial institutions. And, you will be able to make the right investment decision in an FD so as to maximise your returns. Lets get into it, and know how to make more from what we invest in FDs.
Note: Not sure if you should invest in an FD? Read my post here on 3 lesser known reasons why every investor needs an FD.
[Curtain Raiser 1] Highest FD interest rates used in FD Ads/Banners
What is the one thing all investors care the most about?
Returns!
Every retail investor out there is searching for the highest return possible. So much so that these investors switch frequently from one investment asset to another, as soon as they find something which gives better returns. This practise is less than ideal, as it impacts your compounding wealth story. This is a topic for another post. Continuing with the fact that all investors look to maximise the returns on their investments.
This fact is used by all Banks, NBFCs in their FD marketing notifications, and online banners. Lets look at some examples below, before we break into the real truth.

What is the first thing that catches your eye, when you look at above two banners?
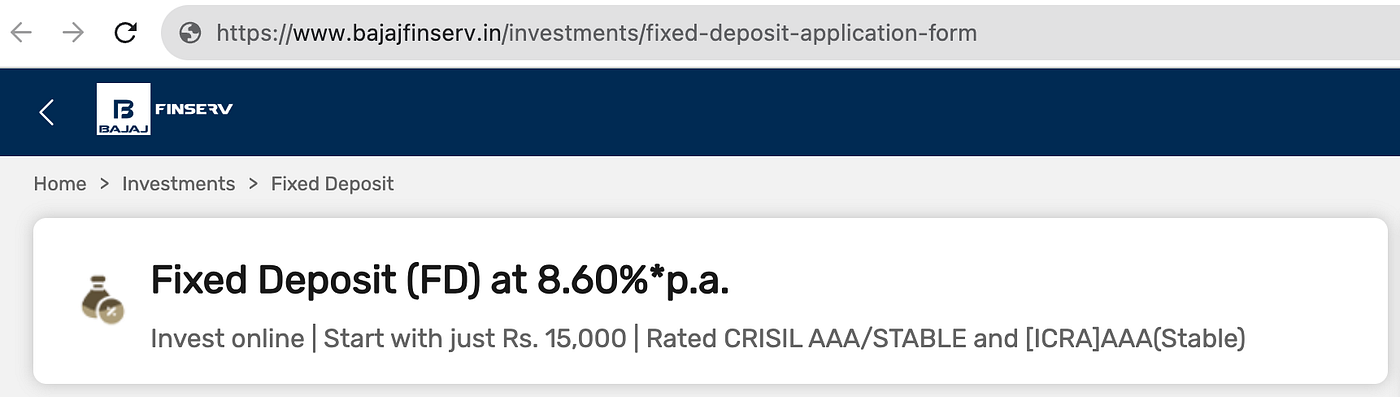
Most of you will respond that Shriram Finance gives 9.10% returns on FD, but Bajaj Finance only gives 8.60%.
Now, here is the truth. You will usually see a small star mark (*) on such claims. This means that there are some terms and conditions mentioned somewhere in a small font. Another trick financial institutions use is for these ad banners to state — ‘Get returns upto X%’. Usage of the word ‘upto’ does not guarantee the mentioned return. It just states that you can potentially get as high as X% returns. This is rarely the case, as we will see next.
There are three main reasons why the marketed FD rates are blown up.
Reason 1: Inclusion of additional rate for Senior Citizen
Senior citizens, who are above the age of 60 years, get an additional 0.50% interest on FDs. Some FD banners include this 0.50% to their peak FD rates, and display the inflated FD rates. Example is Shriram Finance, which includes the 0.50% applicable only for senior citizens in its banners.

If you are not a senior citizen, then you are not eligible for this additional interest rate.
Reason 2: Inclusion of additional rate for Women
This is similar to reason 1. Women investors receive 0.10% additional interest on their FDs. Some banks/NBFCs add this 0.10% to their peak FD rates, and display this inflated rate on their banner.

If you are a male investor, then this additional 0.10% interest is not applicable to you.
Reason 3: Displaying peak FD rate
FD interest rates change based on the investment time horizon. FDs for shorter time horizon (< 1 year) have lower FD rates, than that for higher time horizon (>1 year). FD rates usually peak out in 3–5 years investment time horizon.
Now, usually banks and NBFCs only show you the peak FD rate, which can be for a 5 year investment time horizon. But what if you only want to invest in FD for 2 years? In that case you will get a lower FD rate for 2 year horizon, and not the peak FD interest rate. Phew!
Impact on Investors
Investors can be swayed away by the large font, brightly coloured high interest rates marketed by the banks and NBFCs. These investors might end up investing, only to realise later down in the FD opening journey that the final interest rate applicable to them is lower than what the ad promised.
At this point, the investor is more likely to go ahead and open the FD than drop off. The reason is he/she has already invested the time to go through the steps of opening the FD, only to realise that actual FD interest rate applicable is slightly less than what was advertised.
This should be avoided. It is your hard earned money. Do not just invest it because you invested time in doing KYC etc., to get to the final point of creating the FD.
How can investors avoid such traps?
One can avoid these marketing traps by searching for FD interest rate tables of the said bank or NBFC. Always go to the bank’s or NBFC’s site, or just google search — ‘Bank name Fixed Deposit interest rate table Year’. You will land on a page which shows FD interest rates for different type of investor (Senior Citizen, Women etc.), and time horizon (1 year, 2 year etc.).
This FD rate table should be your source of truth. This is the page you should refer, before deciding which FD gives you higher returns. Yes, it requires some effort to search, surf, and scroll to get to the interest rate table; but it is worth the time.

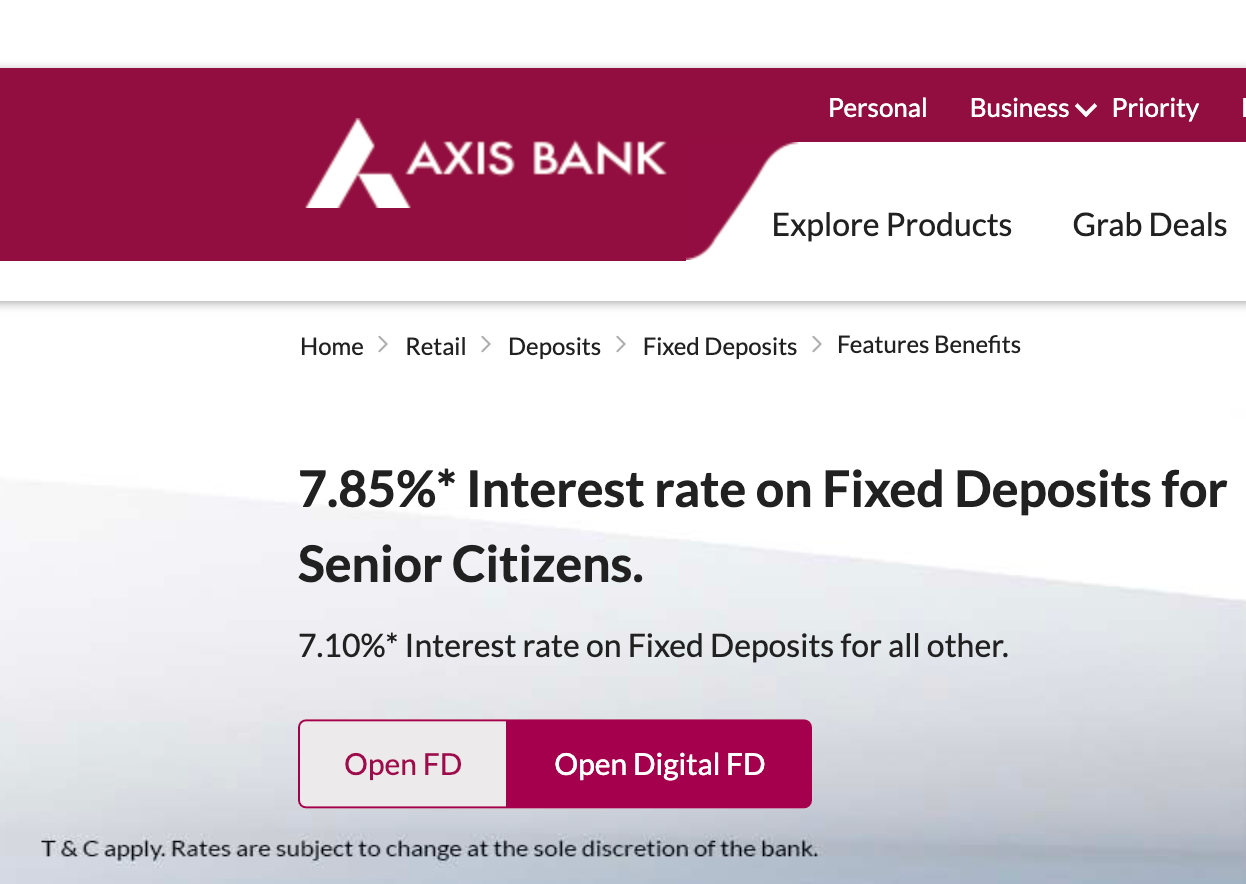
Some banks do clarify in their banners itself the applicable condition for the shown FD rate, which in my view is a good practise. Refer Axis Bank’s FD banner below, which clearly calls out that the displayed FD rate is for senior citizens, and for a normal retail investor, it is something else (lower).
Lets return back to our comparison between Bajaj Finance and Shriram finance FD. Even though Bajaj Finance banner says 8.60% FD rate, and Shriram finance’s banner says 9.10% interest rate; for a normal male retail investor who is less than 60 years of age, Bajaj Finance offers higher peak FD rate of 8.35%, vs 8.18% peak FD rate offered by Shriram Finance.
At this point, you might think that Bajaj Finance gives higher returns on FD. But the story is not over yet. There is one more curtain to lift, which will flip the final FD which gives the highest returns. Lets get into the last layer of transparency
[Curtain Raiser 2] Compounding Frequency impacts Returns
What is compounding?
Compounding simply means reinvesting the earnings you make, back into generating more earnings. Your earnings can be from interest income, or capital gains. The main part is, reinvesting all that your invested amount is earning, back into generating more earnings over time.
As Albert Einstein says — ‘Compounding is the eighth wonder of the world.’ It truly is. Compounding leads to exponential growth of your wealth. It is the reason why patient and long term investors make disproportionate returns on their investment.
What is compounding frequency?
Compounding frequency, as the name suggests, is the time period after which the earnings you have made are reinvested back to generate future earnings. For Fixed Deposits, your earnings are in the form of interest earned from the FD. Hence, this FD interest income is re-invested back to generate more earnings in the future.
FD compounding frequency can be either monthly, quarterly (every 3 months), semi-annually (every 6 months), or annually.
Curtain Raise moment — FD rate is NOT the returns you get !
We have the reached point to raise the second layer of curtain. The FD rate you see, is not the return you get. The reason is, the compounding frequency determines the true returns you will get from a FD. If the compounding frequency if high, it will lead to higher returns, even more than the FD rate. Vice versa, if the compounding frequency if low, you will get lower side of returns.
In that case, what is FD rate you ask? FD rate just means the interest rate offered by the financial institution. It is actually the compounding frequency which determines the final returns you make. See it like this — FD rate is the earnings you get. Compounding multiplies your earnings, by re-investing it more frequently back into principal amount, to make more earnings.
I will explain this point with an example next. This involves some Maths, so feel free to skip this part.
The Math of Real FD Returns
Lets assume you invest in a FD, which offers 8% interest rate, for 3 years time duration. This 8% FD rate is the annual interest rate you will get. Now, lets consider three scenarios -> annual, quarterly, and monthly compounding frequency. For each of these three scenarios, I will calculate the real-returns at the end of three years.
Scenario 1: Annual Compounding Frequency
The annual interest income you get from your FD, is reinvested as principal to generate future returns. Hence the interest you earn is reinvested twice, after year 1, and after year 2. Stats for calculating your real return after 3 years:
FD Annual Interest Rate = 8%
Compounding Frequency: 12 months
Invested Amount: INR 100/-
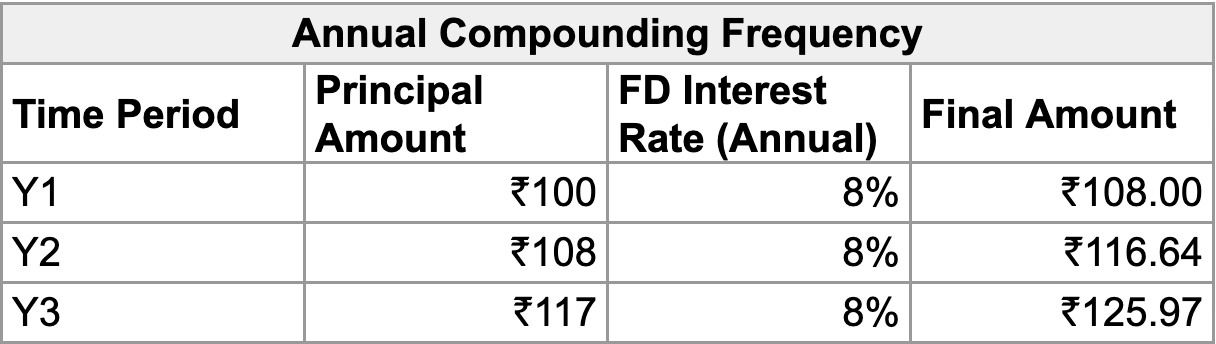
At the end of 3 years, you get back INR 125.97/-, from investing INR 100/-. This leads to real rate of annual return of (Final Amount — Invested Amount)/ 3 years, or (125.97–100)/3 = 25.97/3 = 8.66%.
This real return rate, of 8.66%, is also called Yield. Yield is the naked truth of returns. I will return to this metric soon.
Scenario 2: Quarterly Compounding Frequency
The quarterly interest income you get from your FD, is reinvested as principal to generate future returns. Hence the interest you earn is reinvested four times in a year after every quarter. Hence, in total your interests are reinvested a total of 11 times in 3 years.
Stats for calculating your real return after 3 years:
FD Annual Interest Rate = 8% => 2% interest rate in a quarter (8%/4)
Compounding Frequency: 3 months
Invested Amount: INR 100/-
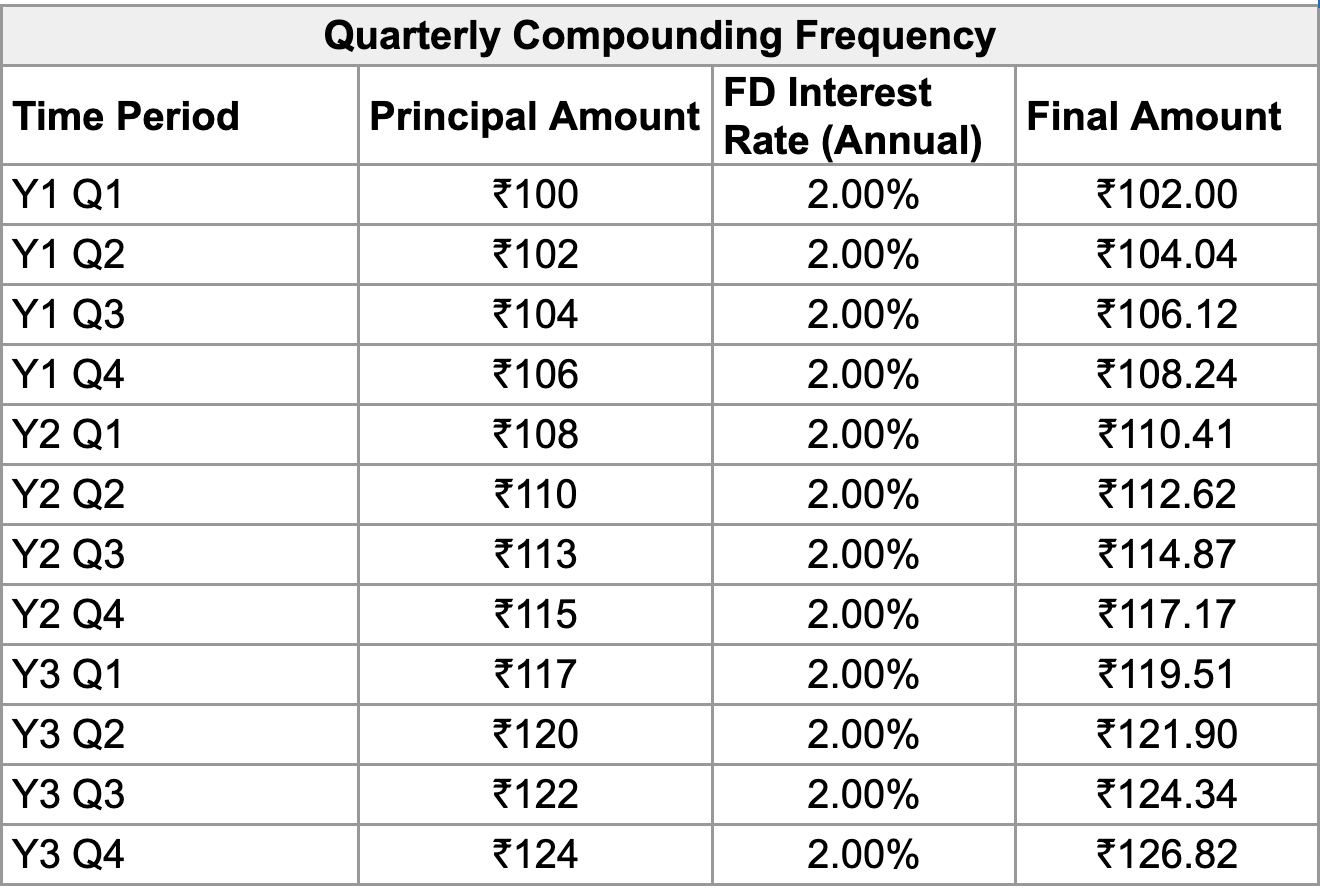
At the end of 3 years, you get back INR 126.82/-, from investing INR 100/-. This leads to real rate of annual return of (Final Amount — Invested Amount)/ 3 years, or (126.82–100)/3 = 26.82/3 = 8.94%.
At this point, you would notice the story this maths is telling you. Quarterly compounding gives you higher returns at the end of 3 years, at a higher yield rate vs what annual compounding gives you.
Scenario 3: Monthly Compounding Frequency
The monthly interest income you get from your FD, is reinvested as principal to generate future returns. Hence the interest you earn is reinvested 12 times in a year after every quarter. Hence, in total your interests are reinvested a total of 35 times in 3 years.
Stats for calculating your real return after 3 years:
FD Annual Interest Rate = 8% => 0.67 % interest rate in a month (8%/12)
Compounding Frequency: 1month
Invested Amount: INR 100/-
Showing the table for 36 months will be too large a table for this post :-). So I will simply put the formula and final output here.
Real Returns = Principal Amount x (1 + monthly FD interest rate)36
= 100 x (1 + 0.67%)3⁶ = INR 127.024/-
At the end of 3 years, you get back INR 127.02/-, from investing INR 100/-. This leads to real rate of annual return of (Final Amount — Invested Amount)/ 3 years, or (127.02–100)/3 = 27.02/3 = 9.01%.
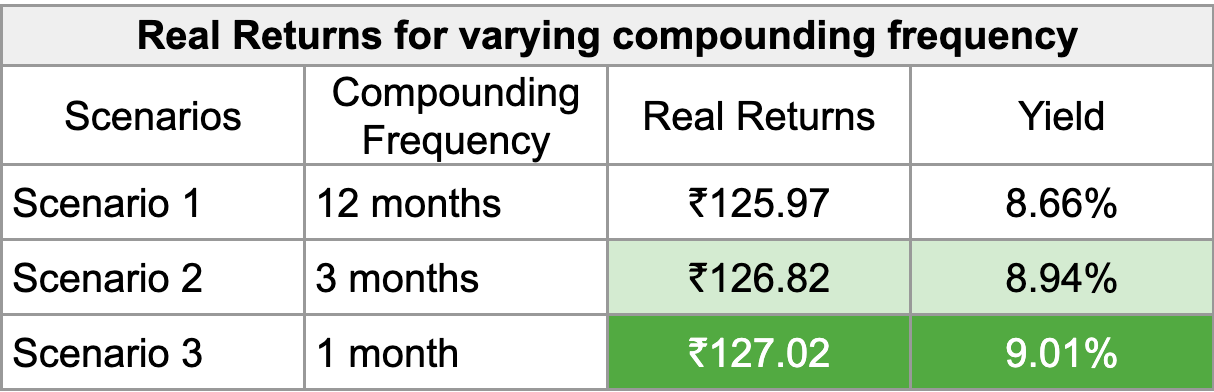
Summary
Higher the compounding frequency, higher the real returns you make, and higher the annual yield.
Always use or refer to annual yield to compare the real returns you will get. If the financial institution do not provide yield, calculate it yourself, or search online to get the yield. Some of the newer Fixed Deposit aggregator platforms such as StableMoney provide yield on their apps.
Lets get back to the comparison between Shriram Finance and Bajaj finance FD returns, and conclude in the next section.
Winner between Shriram Finance and Bajaj Finance FD returns
It is Shriram Finance.
Here is why — Shriram Finance compounds your FD investments every month, whereas Bajaj Finance compounds your FD investments only once every year.
You can find compounding frequency on Stablemoney. Click on yield option as shown in image on the left, to open pop-up which shows compounding frequency. Doing this for Bajaj Finance FD will show the compounding frequency as annual or 1 year (refer image below).

The compounding frequency information is not mentioned on Bajaj Finance FD website, which in my opinion is not transparent. Bajaj Finance FD calculator does mention that the maturity amount is calculated by taking annual compounding into consideration. However this info is layered into the website, and does not explicitly state that a Bajaj Finance FD is compounded annually.
Lets look at the same for Shriram Finance on Stablemoney. It shows that the Shriram Finance has a higher yield of 9.71%, vs a 9.32% yield of Bajaj Finance. And the compounding frequency is monthly for Shriram Finance.

Parting Thoughts
We saw that even a FD which has lower interest rate, can give higher returns if the compounding frequency is high. Money has interesting ways of working. Understanding these smaller nuances are important for us to maximise the returns we look out for.
In my view, the regulations should require all Banks and NBFCs to show the annual yield from the FDs, and not just FD interest rates. Just showing FD interest rates can be misleading, as we understood in this post.
Most of the banks’ FDs have a quarterly, semi-annual, or annual compounding frequency. Shriram Finance is one of the few NBFCs which provides a monthly compounding, increasing the yield and real-returns on your FDs.
Which FD have you invested in, and what is the compounding frequency of that FD? Share in the comments below.
Happy investing!